Roger Malina: “We are still in the stone age of data visualization”
Published 1 February 2016 by Ewen Chardronnet
After a long career in California and France as a physicist and astronomer specialized in ultraviolets and space instruments, Roger Malina currently directs the art and science laboratory at the University of Texas. Makery visited his ArtSciLab at UT Dallas.
Dallas, special report
What made you decide to quit your work as an astronomer at the Observatory in Marseille Provence and enter the field of art and science at the University of Texas?
After 15 years in Berkeley and almost 17 years in Marseille, the University of Texas in Dallas was offering me a new career in art-science research with appointments both in Art and Technology and in Physics. This very young university (30 years is nothing compared to Aix-Marseille University’s 300!) has great new technology facilities. UT Dallas was originally created by the founders of Texas Instruments—the company involved in inventing the integrated circuit in 1958, a major player in the emerging age of information technologies—when they donated the land in 1969. The long-held dream of a UT Dallas engineering school became a reality in 1986 with the Erik Jonsson School of Engineering and Computer Science, now the university’s second-largest school with about 2,700 students.
When I got here in 2013, the student body was about 18,000, now it’s 23,000. The official objective is 25,000, but I think it will reach 30,000. We are totally in the American business model, where the government provides about 20% of the budget and the rest comes from tuition, philanthropic and research funds. Texas Instruments has played a huge role, putting hundreds of millions of dollars into the buildings. They are very, very present in the Engineering and Computer Science design studios, but there are also a lot of high-tech companies in the Dallas metroplex, which is creating more employment. It’s a unique environment with the confluence of philanthropic and corporate interests in higher education, as well as the whole innovation industry.
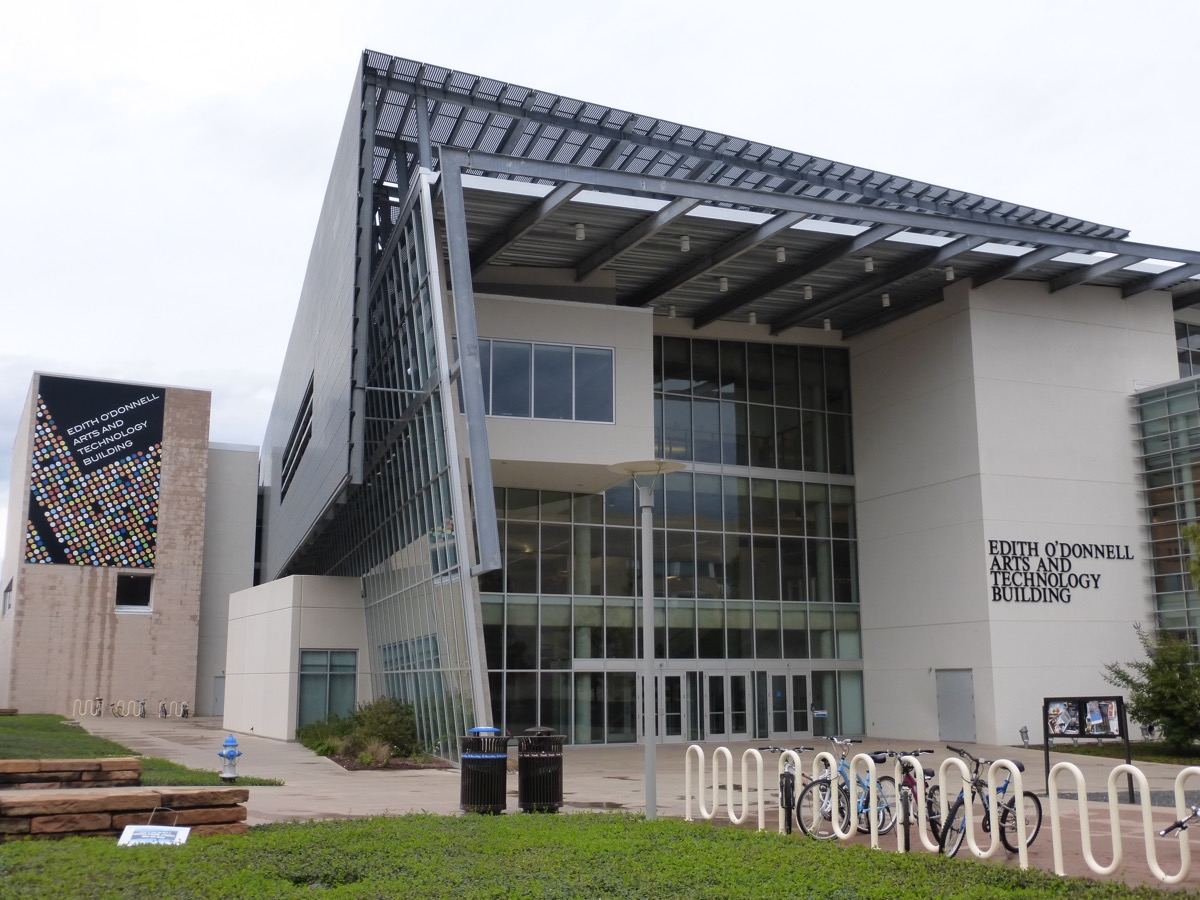
What are the latest developments at UT Dallas?
During the past decade, the University has expanded its teaching mission, improved its external research funding and enhanced its areas of focused excellence. Facilitating that growth are centers and programs that encourage research excellence, such as the School of Behavioral and Brain Sciences, the Center for Vital Longevity, the Center for Brain Health.
The University has taken a very unusual step in setting up the Arts, Technology, and Emerging Communication (ATEC) program as a full school; enrollment is already 1,300 students, headed toward 2,000. The ATEC program seeks to transcend existing disciplines and academic units by offering a comprehensive degree designed to explore and foster the full range of areas that exploit the convergence of science and engineering with creative arts and the humanities. ATEC faculty include not only sound design, gaming and animation, but also experimental psychology, art history, mobile health and e-journalism, user experience design, 3D fabrication and fablabs.
Can you tell us a bit about your ArtSciLab?
The ambition is to work on projects that cannot be done without the collaboration of artists and scientists. The first area is developing new ways of representing and exploring data. I strongly feel that we are in the stone age of data visualization, like at the beginning of the invention of perspective. We receive so much information and feelings about the world through mediated data, but it is so primitive compared to human perception and its ability to integrate multimodal sensory interactions with the world!
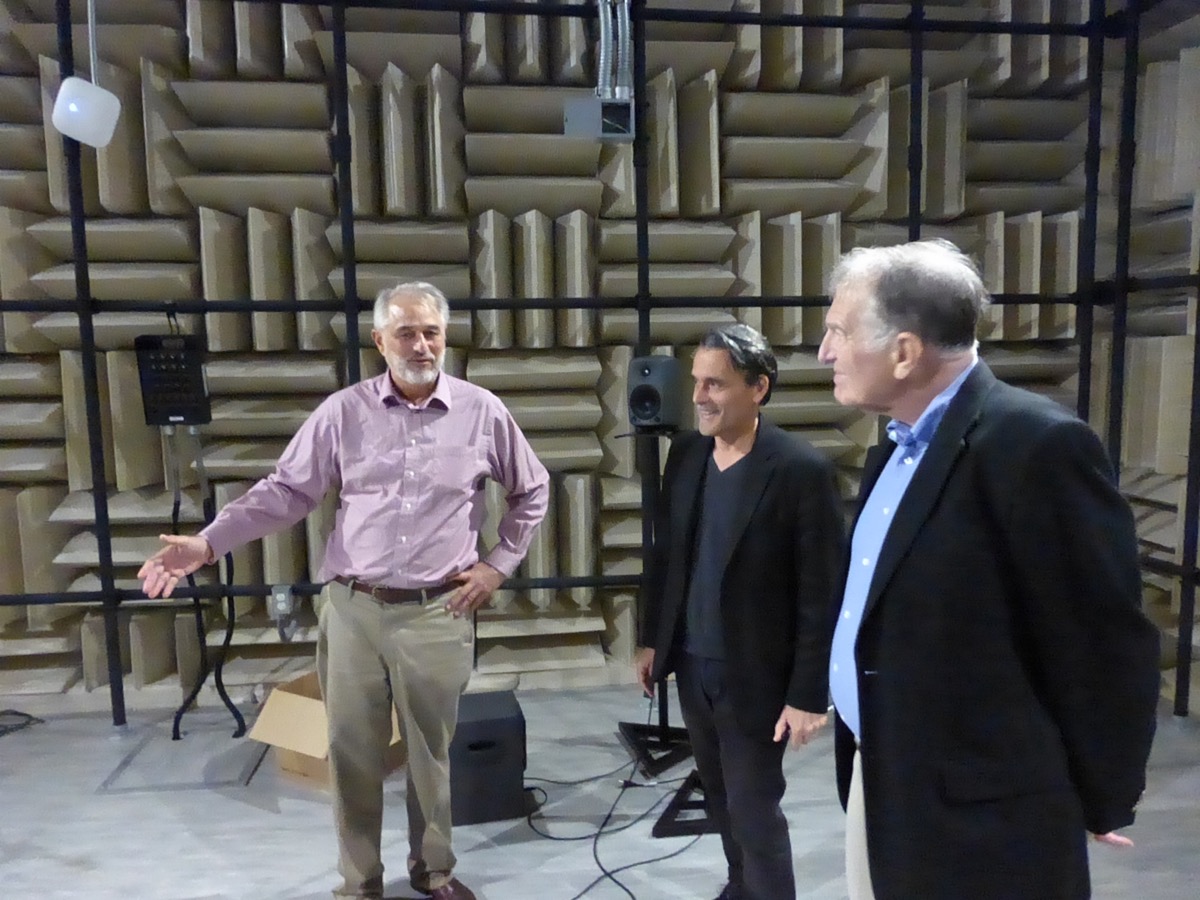
The sound studios are amazing…
Well, I think artists and media designers are the new experts in data representation. Clearly, they can make a living from converting data into representations, and science can work with them. We’re working with a local geoscientist, who gave us access to the maps and data of the state of Texas. Texas is one of the best-mapped parts of the world, down to each meter of soil, both above and below the surface.
So we took a map of different types of sediments in Texas, and added some sonification and data visualization tools to develop the “Texas Gong”, a sort of “data dramatization” display. There have been hundreds of things like this, but most of the time, nobody uses them. Here, the ear can identify things that the eye can’t.
Texas Gong of sonified data for different types of sediments:
Why would people remember more data this way?
In perception science, visual memory and sound memory are not on the same mode. It’s actually much easier to recognize something you heard earlier, such as bird song, than something you saw earlier. There have been some interesting studies on how you can use sound, considering the fact that sonic memory is longer than visual memory. With sound, we can add dynamics to sets of data that are very difficult to remember.
There have been all kinds of sonification tools, but most remain at the toy level. This tool can be further developed, you can train people to use it. We call it technologies of attention.
“The challenge is to demonstrate that scientists can make discoveries using sonification that they would not make with visualization alone. This is obvious in daily life, but not when the computer is between you and the world.”
Roger Malina
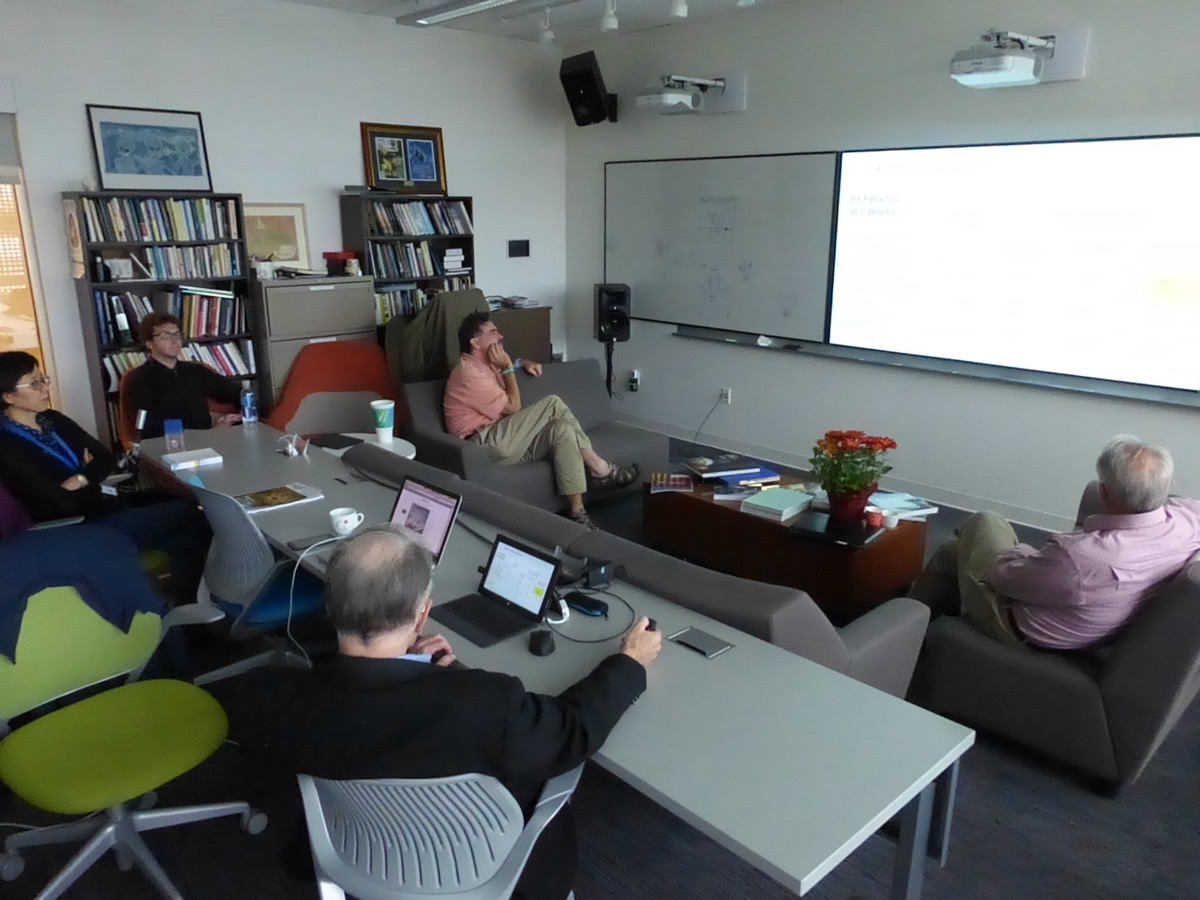
Can you tell us more about the “data stethoscope”, which sonifies brain activity?
We have started an exciting collaboration with Prof. Gagan Wig in Behavioral and Brain Sciences, who was frustrated by the standard data visualization tools available to him and his research group. He studies the internal structure and connections of brains of healthy people, aged 20 to 80. He uses what is called functional magnetic resonance imaging (fMRI) data to probe which areas of the brain are strongly synchronized. It’s a bewilderingly complex network that is dynamic and changes with age and experience.
We developed a “data stethoscope” to create a visual and sonic representation of highly connected areas in the human brain. In comparison, the doctor’s stethoscope is a sonic tool that captures sounds emitted by internal organs of the body for diagnosis.
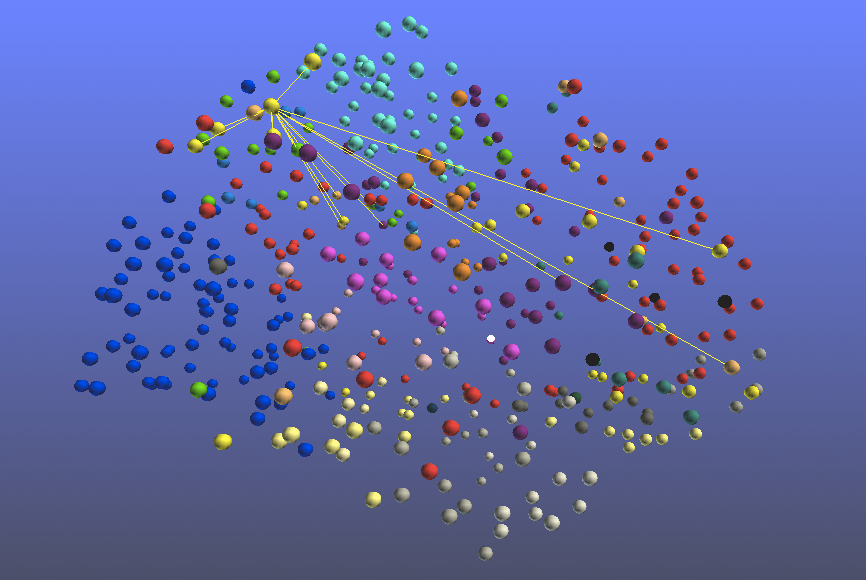
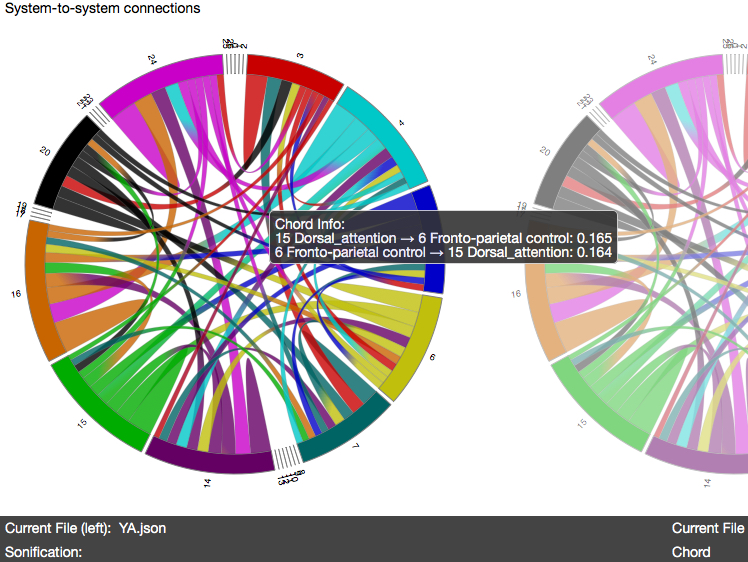
The idea is to do this as well as a traditional stethoscope with data, not only as a tool for scientific research, but also as a tool for art creation. In the process of developing the software, the tool was built to interface with musical instruments for real-time visualization and sonification.
Working conceptually with the idea that scientific data can be repurposed for art, the team of artists, scientists and computer designers came up with a system that can be used as a performing art tool for both sonic and visual representations, scientific investigation of fMRI data, and manipulating the model in real time as a form of multimodal data dramatization.
Brain Gong of fMRI data:
What about ArtSciLab’s second activity of experimental publishing?
This comes out of my 30 years working as executive editor of Leonardo Publications at MIT Press. Artists and researchers in this community have been early adopters of every technology that can be used for self-expression, for documenting and showing work to others. We have no idea what publishing will look like in 50 years, so the idea is to be in a mode of continuous experimentation to see which approaches can become general purpose and adapted to new modes of expression.
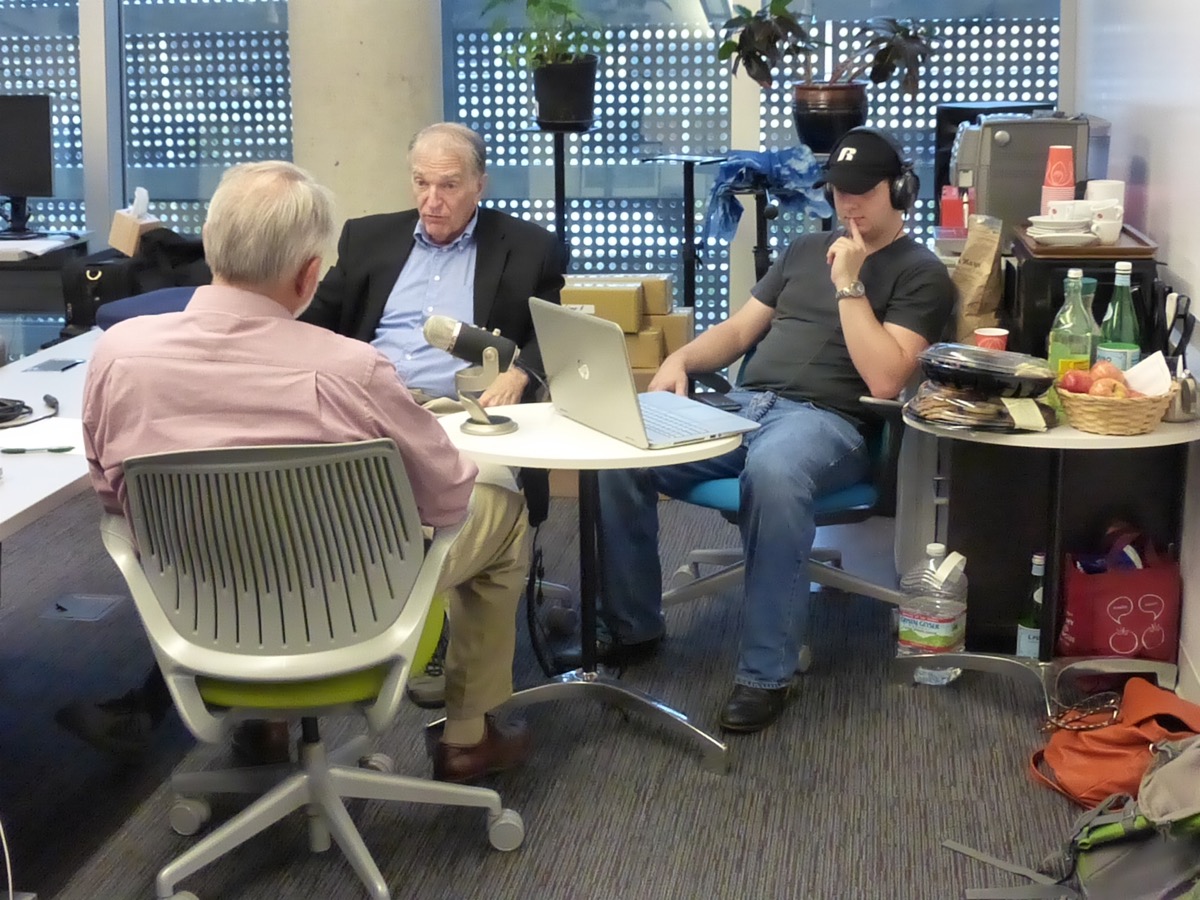
First, we are managing the Creative Disturbance podcast platform, which supports collaboration among the arts, sciences and new technologies. Supported by Leonardo, the platform was created a year ago together with the students, faculty and research fellows here and is doing very well—bout 25,000 podcasts have been downloaded. MIT Press was so impressed by the whole project that we’re now moving to be hosted on their website. We have a list of channels in Arabic, French, Spanish, and so on, where people can put as many podcasts as they want.
From the very beginning, we have been resolutely multilingual, so podcasts can be in any language. The latest channel is in Farsi by a young Iranian student, a South Korean student has started a channel for women engineers… We also rebroadcast podcasts, like the ones on climate change from the Human Impacts Institute in New York.
What is the next step?
Later this spring with MIT Press we are launching the ARTECA art, science and technology aggregator. As a start, we will be making available hundreds of e-books and tens of thousands of articles published by MIT Press, but our real interest in is ‘grey’ literature. Today, the vast majority of important literature is self-published and does not go through traditional publishers, journals or books. How can we capture this key influential literature, or do ‘peer’ reviewing or selection after the material is published? How can we provide the archiving function traditionally carried out by publishers and libraries?
There have been many developments in alternative metrics, trendspotting software, deep learning, reputation management. Once we open up ARTECA, we will be looking to collaborate with researchers in data and information science to imagine how professionals in the next decades will document their work and show it to others, and how we can build a smart adaptive system that identifies and archives key seminal ideas and literature that is initially self-published.
Again, we want to cross the scientific and engineering aspects with the arts and humanities, in particular how experimental poets are developing very different ways of structuring experiences using digital media.
UT Dallas’s ArtSciLab website
Creative Disturbance podcast platform
